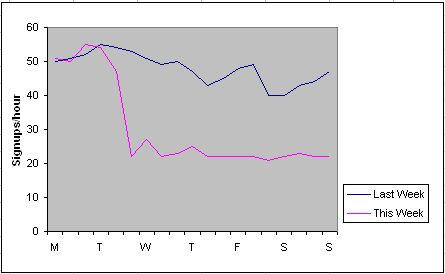
When running an operations group, it’s important to have monitors and alerts to let you know when things go wrong with your servers and services. When a server crashes, or a hard disk dies, it’s easy to pinpoint the problem and fix it quickly. The problem with complex interacting systems, is that the system can be “down” or non functional from a business point of view, while all the things you are monitoring are showing “all green”
I had the opportunity to talk with scalability gurus and former ebay architects Marty Abbott and Tom Keeven. They talked about the idea of operation teams monitoring business metrics as an indicator of system health.
 Here’s an example (not real data from my company!) of week over week graphs of user account signups/hour. You should pick the metrics and sampling rate to be statistically significant and also keep in mind that seasonal variations and even social events can affect some types of web business metrics. They sited a fun example from when they were at ebay, of noticing a significant drop in use of the site at 7pm eastern time on a Monday. It took them a while, but they finally figured out that was when American Idol was on! They ended up installing a TV in their Network operations center.
I’m getting Marty Abbot and Michael Fisher’s book, “The Art of Scalability” and look forward to reading more great tips like this. Check out their book on Amazon: